
Part 1 – Non-coherent DSB AM Radio
Create the following AWR System Diagram. Use the setting from before. The low pass filter (LPFB) has the parameters shown. Note DC=1.5.
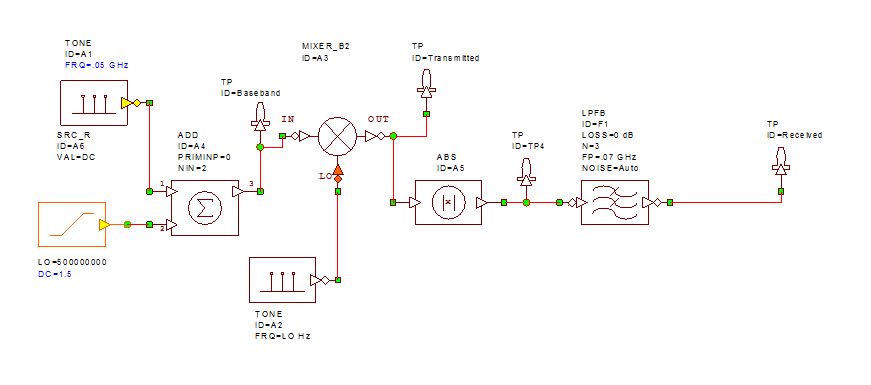
This is a basic non-coherent radio. The ABS and LPF are equivalent to a diode peak detector. The diode would rectify the signal and the capacitor and resistive load of the receiver (e.g. speaker) would create a low pass filter.
Assignment (you should insert your answers here in the WORD document) (3pts):
- Plot the waveforms of the Baseband, Transmitted and Received signals
- Plot the spectrum of the same. Explain each delta function in the three spectrums.
- In a short sentence, compare the Transmitted and Received signals (qualitatively).
Now run the simulation again, but click on the “tune” slider (upper right of the tool bar). Reduce DC until the BB waveform just touches 0V.
Assignment(1pt): How does the Rx signal behave? How does the Tx signal behave?
Reduce DC to 0.25 V and run the simulation. Change the BW of the LPF to 0.1 GHz – it will help see the change.
Assignment (5pts):
- Plot the Tx and Rx waveforms.
- How does the Rx signal behave?
- How does the Tx signal behave?
- Is it possible to remove the DC and not transmit the carrier?
- Is this radio working properly?
Part 2– Coherent DSB AM Radio
We will now examine a coherent receiver for AM radio. Create the following System Diagram:
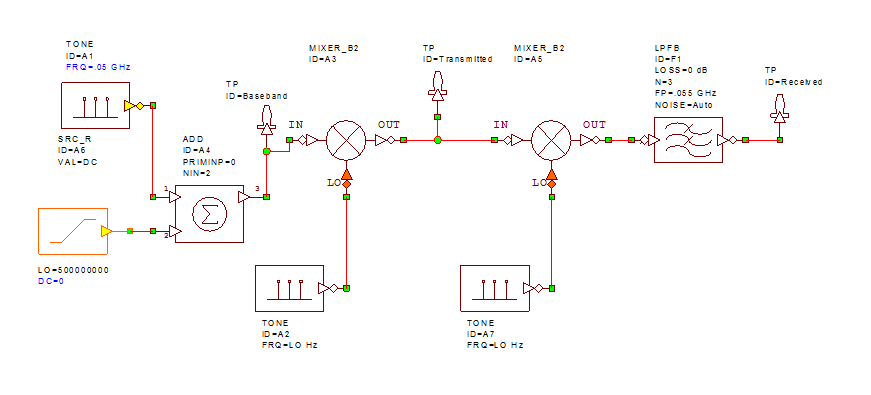
Note that the DC is now set to DC=0.
Assignment (7 pts):
- Calculate analytically what the received signal should be. You should do this with cosines and sines. Does it match your received signal?
- Plot the waveforms of the Baseband, Transmitted and Received signals
- Plot the spectrum of the same. Explain each delta function in the three spectrums.
- In a short sentence, compare the Transmitted and Received signals (qualitatively).
- Can this radio operate at DC=0? If so, why can the conherent operate when the non-coherent cannot?
- Can this carrier be fully suppressed with a coherent receiver?
- Change the Phase on A7 to 45 degrees. This would represent a mismatch in the receiver oscillator and the transmitters oscillator. What is the effect on the the Transmitted and Received signals (qualitatively).
Part 3 – Quadrature DSB AM Radio
We will now examine quadrature modulation of analog signals. Create the following System Diagram:
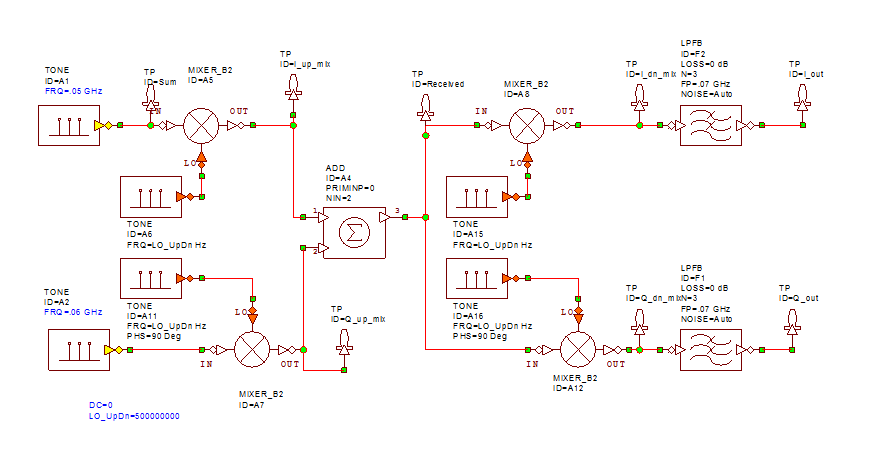
The two input TONEs, A1 and A2, are at .05 GHz and .06 GHz, respectively. We use two different frequencies to see if we can simultaneously transmit two signals and received them. The two TONES A6 and A11 have the same frequency: LO_UpDn, however note has A11 has a 90 Deg phase shift. This is equivalent to a sine in reference to A6 as a cosine.
Assignment (5pts):
- Calculate analytically what the received signal should be. You should do this with cosines and sines. Does it match your received signal?
- Plot the waveforms of the I_up_mix, Q_up_mix and Received. Note the Received is simply the sum of the I+Q and would be also what is transmitted. Comment on each waveform.
- Plot the waveforms of the I_out, Q_out and Received. Comment on each waveform.
- Change the phase in A11 to 60 degrees. This would represent an imperfect quadrature (90 degrees) between the cosine and sine sources. Plot the waveforms of the I_out, Q_out and Received. Comment on each waveform.
- Change the phase in A11 to 0 degrees. This would represent cosine for both sources. Plot the waveforms of the I_out, Q_out and Received. Comment on each waveform.
Part 4 – SSB AM Radio
We will now investigate a SSB radio. Construct the following System Diagram:
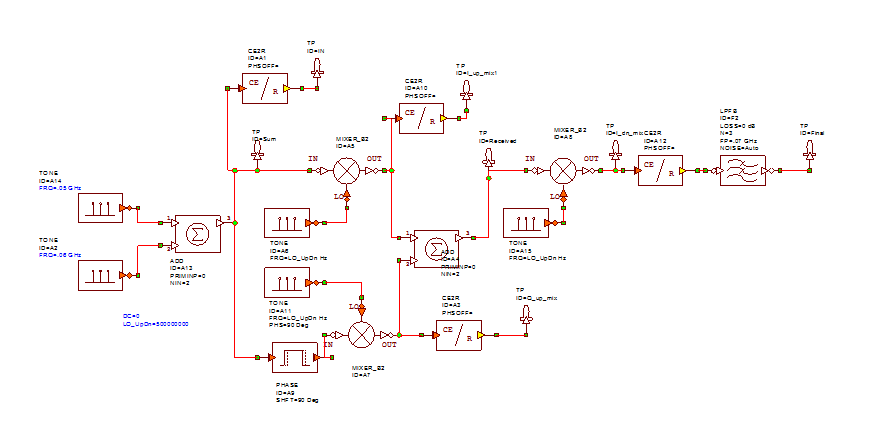
You can start with your quadrature modulator. There are only two differences. 1) The Q signal path has a 90 degree phase shift. 2) You are not inputting to different signals, but rather the same signal to both the I and Q path. In this example the input signal is the summation of 0.05 and 0.06 GHz tones. This is done just to make the spectrum look more full. You could do with just one tone. There are several CE2R blocks. These are to allow us to see the complex signals on those paths.
Assignment (3pts):
- Plot the waveforms for the input (IN) and the two up-converted signals, I_up_mix and Q_up_mix, as well as the Received signal and the output signal, Final. Comment on all waveforms.
- Plot the spectrum of the same signal. Comment on all peaks/delta functions. In particular, compare the spectrum of Q_up_mix and I_up_mix individually to Received, which is the sum of the two signals.
- Change the phase shift in the Q path to 60 degrees and re-plot the spectrum. What has changed?
Save this WORD document as a PDF, using the “minimum size” option to reduce the size. After all submission, you will receive two other labs by classmates to grade. Peer grading represents 30% of your lab grade. (you just have to complete it to get the full credit).
Comments are closed.