
Part 1 – Start VNA and Calibration
Vector Network Analyzer (VNA) is widely used for S-parameters measurement of the Device Under Test (DUT). The system diagram of the S-parameters measurement test using VNA is shown below.
Picture cited from https://www.rfcafe.com/
VNA Operation
The following pictures show the test bench of S-parameters measurement using VNAuhf.
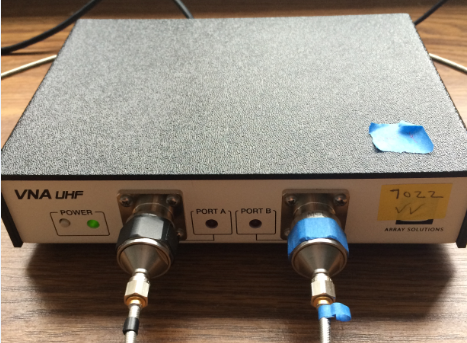
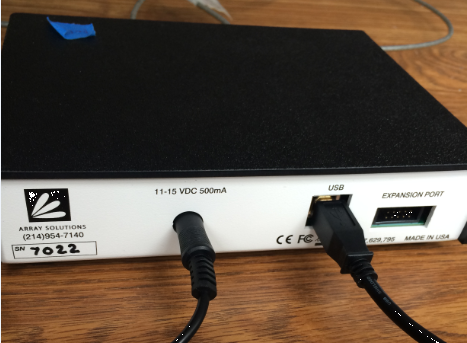
The circles in the above picture from left to right indicate power button, port A, port B, power input port, PC control port. Note on the left that the RF connectors are large. These are called N-connectors. The smaller cables are SMA cables. The names refer to the size, connector type and frequency range. On the output of the VNAuhf we have placed N-SMA adapters. The SMA cables attach to these adapters.
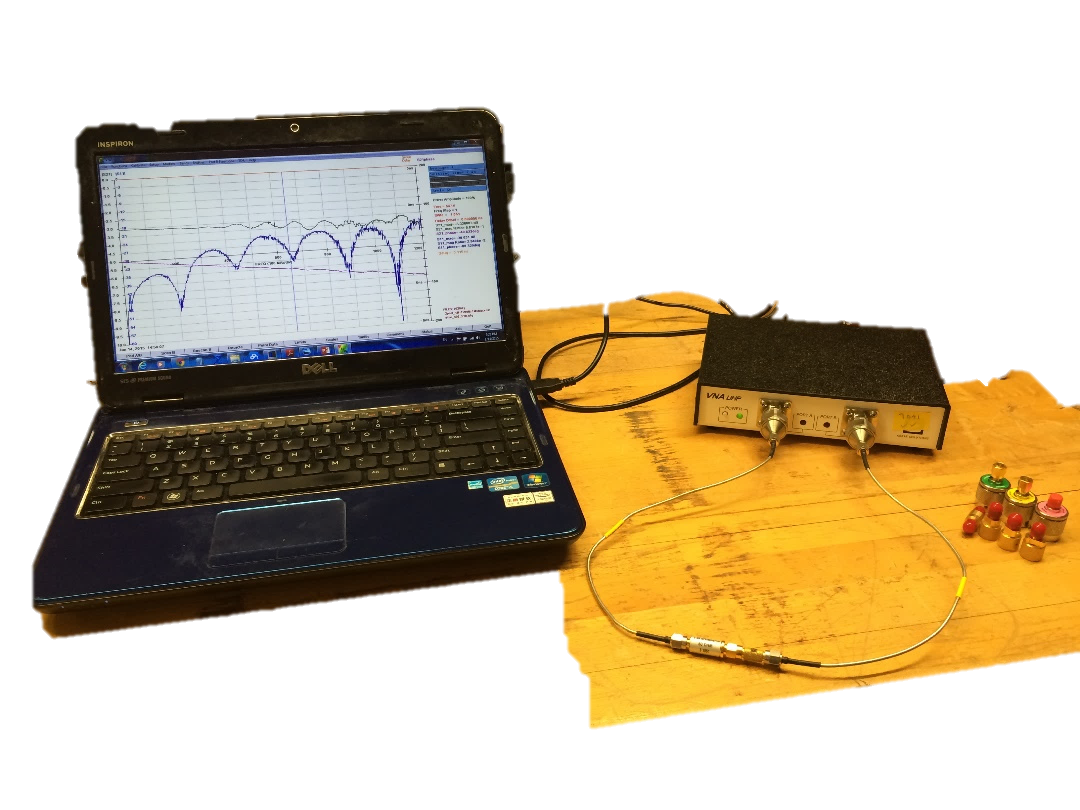
In the picture above you can see the VNAuhf connected to a laptop. You also see the N-SMA adapters along with two SMA cables. The Device Under Test (DUT) is connected between the two SMA cables. The goal of de-embedding, or calibration as it is also called, is to move the reference plane of the measurement to the end of the two SMA cables. These ends then become your measurement points. Everything you measure then is connected to these SMA cables, after you have calibrated.
Press the power switch. The red LED’s will blink a few times to indicate the controller program is running. The red LED’s then remain off except when a scan is being performed. To turn off the power, press the power switch again.
Calibration
The function of calibration is to move the reference plane from the two outputs of VNA to the two ports of DUT (the ends of the SMA cables).
There are 4 different calibration terminations
- Short Termination – the connector with an internal short circuit with labeled “short”.
- Open Termination – the connector with an internal open circuit with labeled “open”.
- Load Termination – the connector with a constant 50 Ohm resistance with labeled “50 Ohm”.
- Through Termination – the connector used to combine two ports together with regarded as zero-length reference.
It should be mentioned that calibration terminations provided in the lab are SMA termination connected to the SMA to N-type adapter. See the picture below.
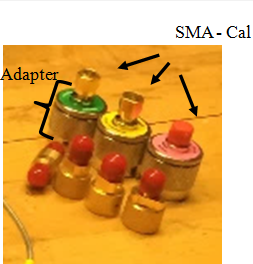
Before the calibration, the SMA calibration terminations should be removed from the N-SMA adapter since we are calibrating at the end of the SMA cables and thus will need a calibration standard with SMA connectors. We keep them on the n-SMA adapters as they are too small to label, but the adapters are labeled, so we can remember which standard is which. Note the “OPEN” is just a plastic cap – instead of moving the plastic cap to the SMA cable for the Open Termination, you can just leave the SMA cable end “open”, i.e. nothing attached. At higher frequencies a precise OPEN is needed so there is actually a termination that is attached. In our work we are low enough in frequency, simply leaving the cable “open” is good enough.
FYI: The polarity of port of connector or cable can be male polarity or female polarity. If there is a pin inside the port, the polarity is male. If there is a hole inside the port, the polarity is female. The male polarity port can be connected to male polarity port through female to female connector.
Click on the Calibrate menu. Click Standard Cal to calibrate the full range (5kHz to 1200MHz) of the VNA.
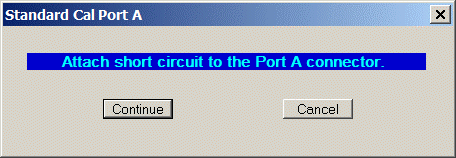
According to the appeared message box above, attach the short termination to the connector on Port A. After the short circuit is in place, click Continue. The short circuits calibration is not completed until a new message box appear as below.

Disconnect the short termination. Attach the open termination in the same way as the short circuit. After the open circuit is in place, click Continue. The open circuit’s calibration is not completed until a new message box appears as below.
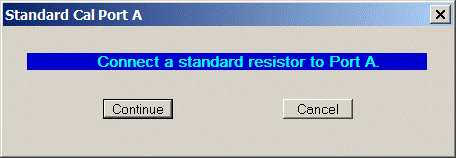
Disconnect the open termination. Attach the load termination in the same way as the short circuit. After the load termination is in place, click Continue. The value of calibration resistor is set as 50 Ohm. After calibrating Port A, continue to calibrate Port B. A new message window appears as below.
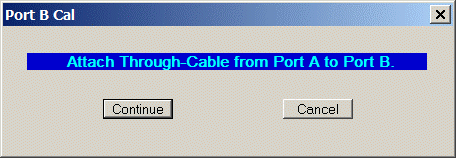
Disconnect the load termination. Use through termination to connect the connector on Port A and connector on Port B. After the through termination is in place, click Continue. After calibrating Port B, save the calibration file for further use.
Measurement Setup
VNAuhf has two types of modes, Port A mode and Port B mode. Port A mode is used to measure the performance of 1-port DUT, and Port B mode is to measure the performance of 2-port DUT.
In Port A mode, SWR and input impedance can be measured. In Port B mode, S11 and S21 can be measured. The mode can be switched by clicking “Port A/B” button on the left lower corner of the software platform. The steps of SWR measurement of 50 Ohm load is given as an example. This example is not scored, but operating the example helps to use the software and examine the calibration.
Connect a 50 Ohm Load Termination to Port A connector. Choose Port A mode. The current Port status can be observed from the bottom tool button named as “Scan A”. Note: the Load Termination is a precision 50 resistance that has been tuned/measured for the whole frequency range. Its parasitics have been minimized or, in advanced systems, measured and are included in software the VNA uses for calibration. A 50 thru-hole resistor would not work above a few MHz.
Click on the Setup menu. Click Plot Parameters to choose the parameters that will be plotted. Graph A indicates the plots in Port A mode, and Graph B indicates the plots in Port B mode. Left axis means the plots will be scaled by left axis, and Right axis means the plots will be scaled by right axis. Check the box of SWR from Graph A – Left axis.
Click on Scan A from the bottom buttons to scan SWR on full frequency. SWR stands for Standing Wave Ratio. The concept of standing waves was not covered in class, but you can find a quick tutorial at: https://en.wikipedia.org/wiki/Standing_wave_ratio When you are impedance matched, it is 1. When you have an open termination, it is 2 and when you have a short it is 0. The value of SWR can be read from left axis. The right sidebar indicates the value on where the cursor is placed. Because the transmission line and load is perfectly matched, SWR should be equal to 1. Examine SWR plot and compare the plot with analysis.
The data can be saved as either a picture or a data list. Click on the File menu. Click Save Image BitMap to save the graph as a picture. Click Save Port A Graph to save the graph as a data list. Though the data file is saved in .scn format, the data file in .csv format with the same file name is generated simultaneously in the same category. The data file in .csv format can be opened in Excel which can be used to plot the SWR curves in Matlab.
There are twelve bottom buttons (the bold is important):
- Port A/B – the switch between Port A mode and Port B mode.
- Scan A – the scan on specified frequency limits with previous data cleared.
- Rescan A – the scan on specified frequency limits with previous data not cleared.
- Recycle – the repeated scan until Recycle or Halt button is click.
- Point Data – the measurement of impedance at a specified frequency.
- Limits – the measured frequency limits with start and stop frequencis and the size of frequency increment.
- Scales – the full-scale values for the plotted parameters.
- Smith – the smith chart for Port A.
- Comment – A dialog box pops up for you to enter a comment that will be displayed at the bottom of the graph.
- Status – Display a window with the currently programmed parameters and file names.
- Halt – While the scan is in progress, you can stop it by clicking this button.
- Quit – the exit of program.
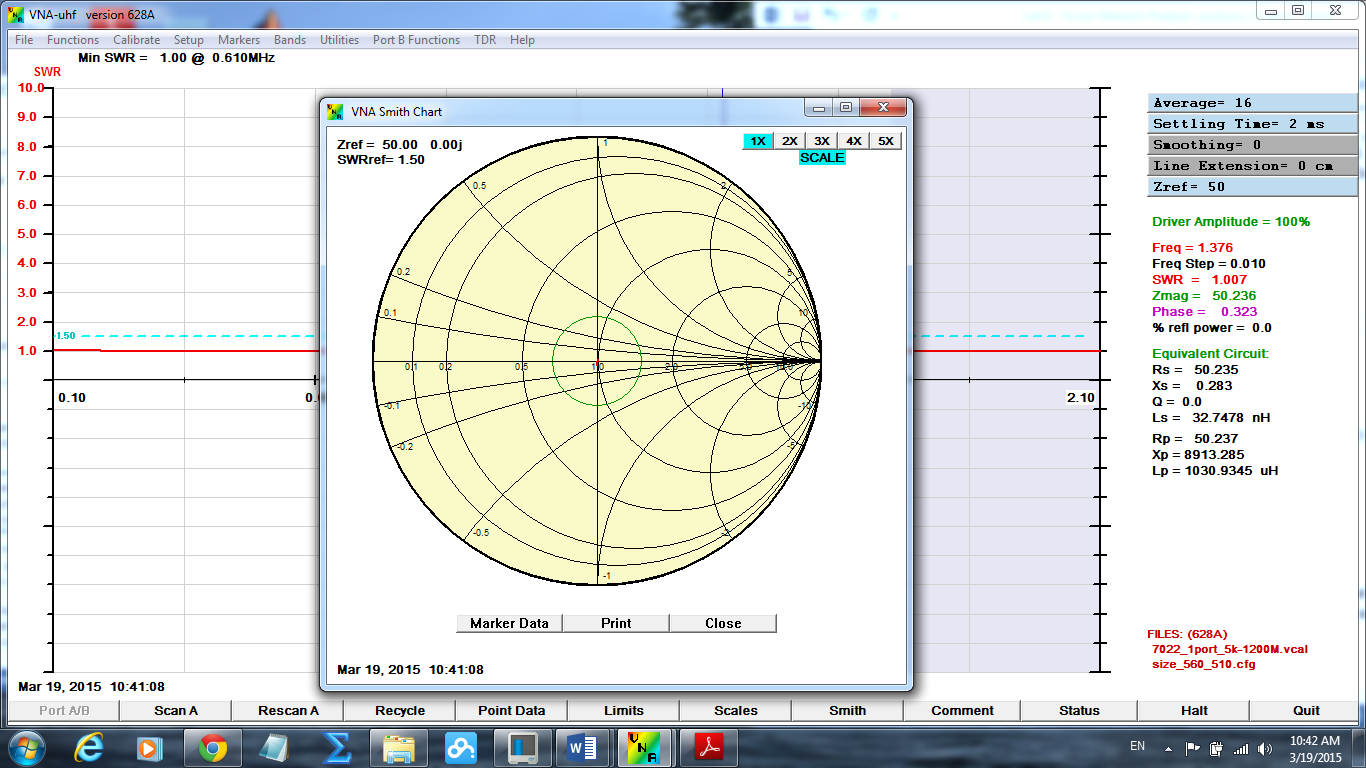
Click Smith on the bottom buttons. The smith chart for Port A is shown below. The green circle is reference circle for SWR=1.5. The red curve is the measured curve. The graph below is an example for Smith chart when the VNA connects to 50 Ohm load.
Part 1- 1-Port Measurement
Power on VNAuhf. Complete two-port calibration over the full range frequencies. Our DUT for this assignment is a SMA cable with the Short termination at one end. Note that you do not disconnect the SMA cables attached to the VNAuhf – they are your measurement connections that are now calibrated. Use the third cable provided and the Short Termination as you DUT. Connect the end of the DUT without the Short Termination to Port A.
Assignment (4 pts):
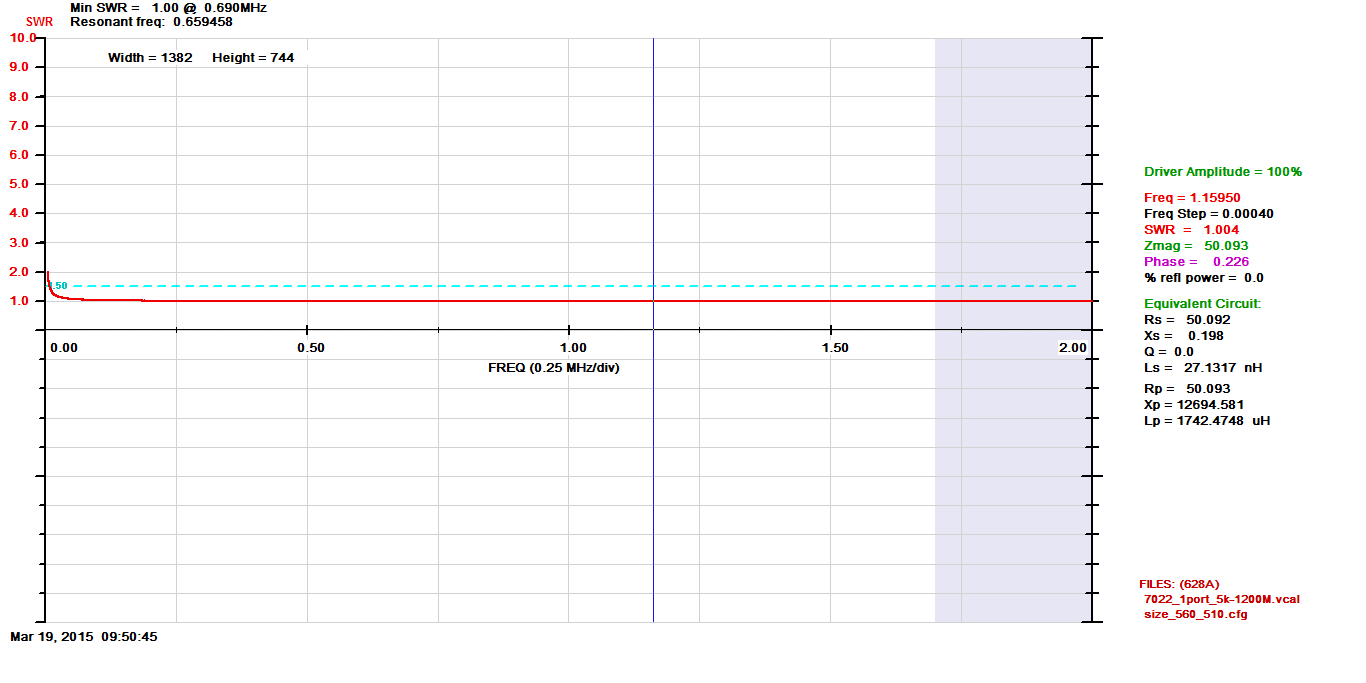
- In Port A mode, save the image of the amplitude of impedance of the cable with a shorted termination ended. Comment on the variation of the curve, including the analysis on the DC point, first peak point and first minimum point (not DC point). (1pts)
- Find the frequency that measured cable has the electrical length of 180 degrees or /2. This can be done by noting the short turns into an open at /4 and then a short again at /2. The SWR of a short is zero. Now change the frequency limits of the software so that you are only looking at 0.1 MHz to the frequency where the DUT cable is /2. Save the image of the amplitude of impedance for the same DUT in a proper scale. What’s the first resonant frequency for the cable (SWR~2)? (1pts) Click on the Smith Chart and locate the frequencies where the DUT cable looks like an Open and a Short. Insert the Smith Chart below and list the frequencies of the DUT cable at an Open and Short. (1 pts)
- Use the same frequency range in the previous step. Calculate the speed of wave in the cable at first resonant frequency. Make a comparison between the speed of wave in the cable and light speed. Hint: the wavelength at certain frequency equals to the speed of wave divided by that frequency. A ruler or tape measure can be used to measure the physical length of the measured cable. (1pts)
Part 2– 2-port DUT measurement
Port A/B mode measurement is used for 2-port DUT. If Pot A/B is not black on the lower menu bar, you may need to restart or recalibrate. If you calibrated in A/B mode it should be there.
Power on VNAuhf. Complete two-port calibration on full range frequencies. Our DUT is now a 20 dB attenuator that is placed between the two measurement SMA cables.
Change the plot parameters to S11 and S21.
Assignment (4 pts):
- In Port B mode, save the image of the S11 and S21 of the attenuator with a proper scale. (1pts)
- In Port B mode, save the data to the file. Paste below a table or plot in Excel or Matlab plot (no screen shot) of the magnitude of S11, phase of S11, magnitude of S21, and phase of S21 at 10 different frequencies (free to choose 10 consecutive frequencies). (2pts)
- Comment on the S11 and S21. Are they correct? If Yes/No, explain why they are correct or not. (1 pts)
Comments are closed.