
Part 1 – Spectrum Analyzer
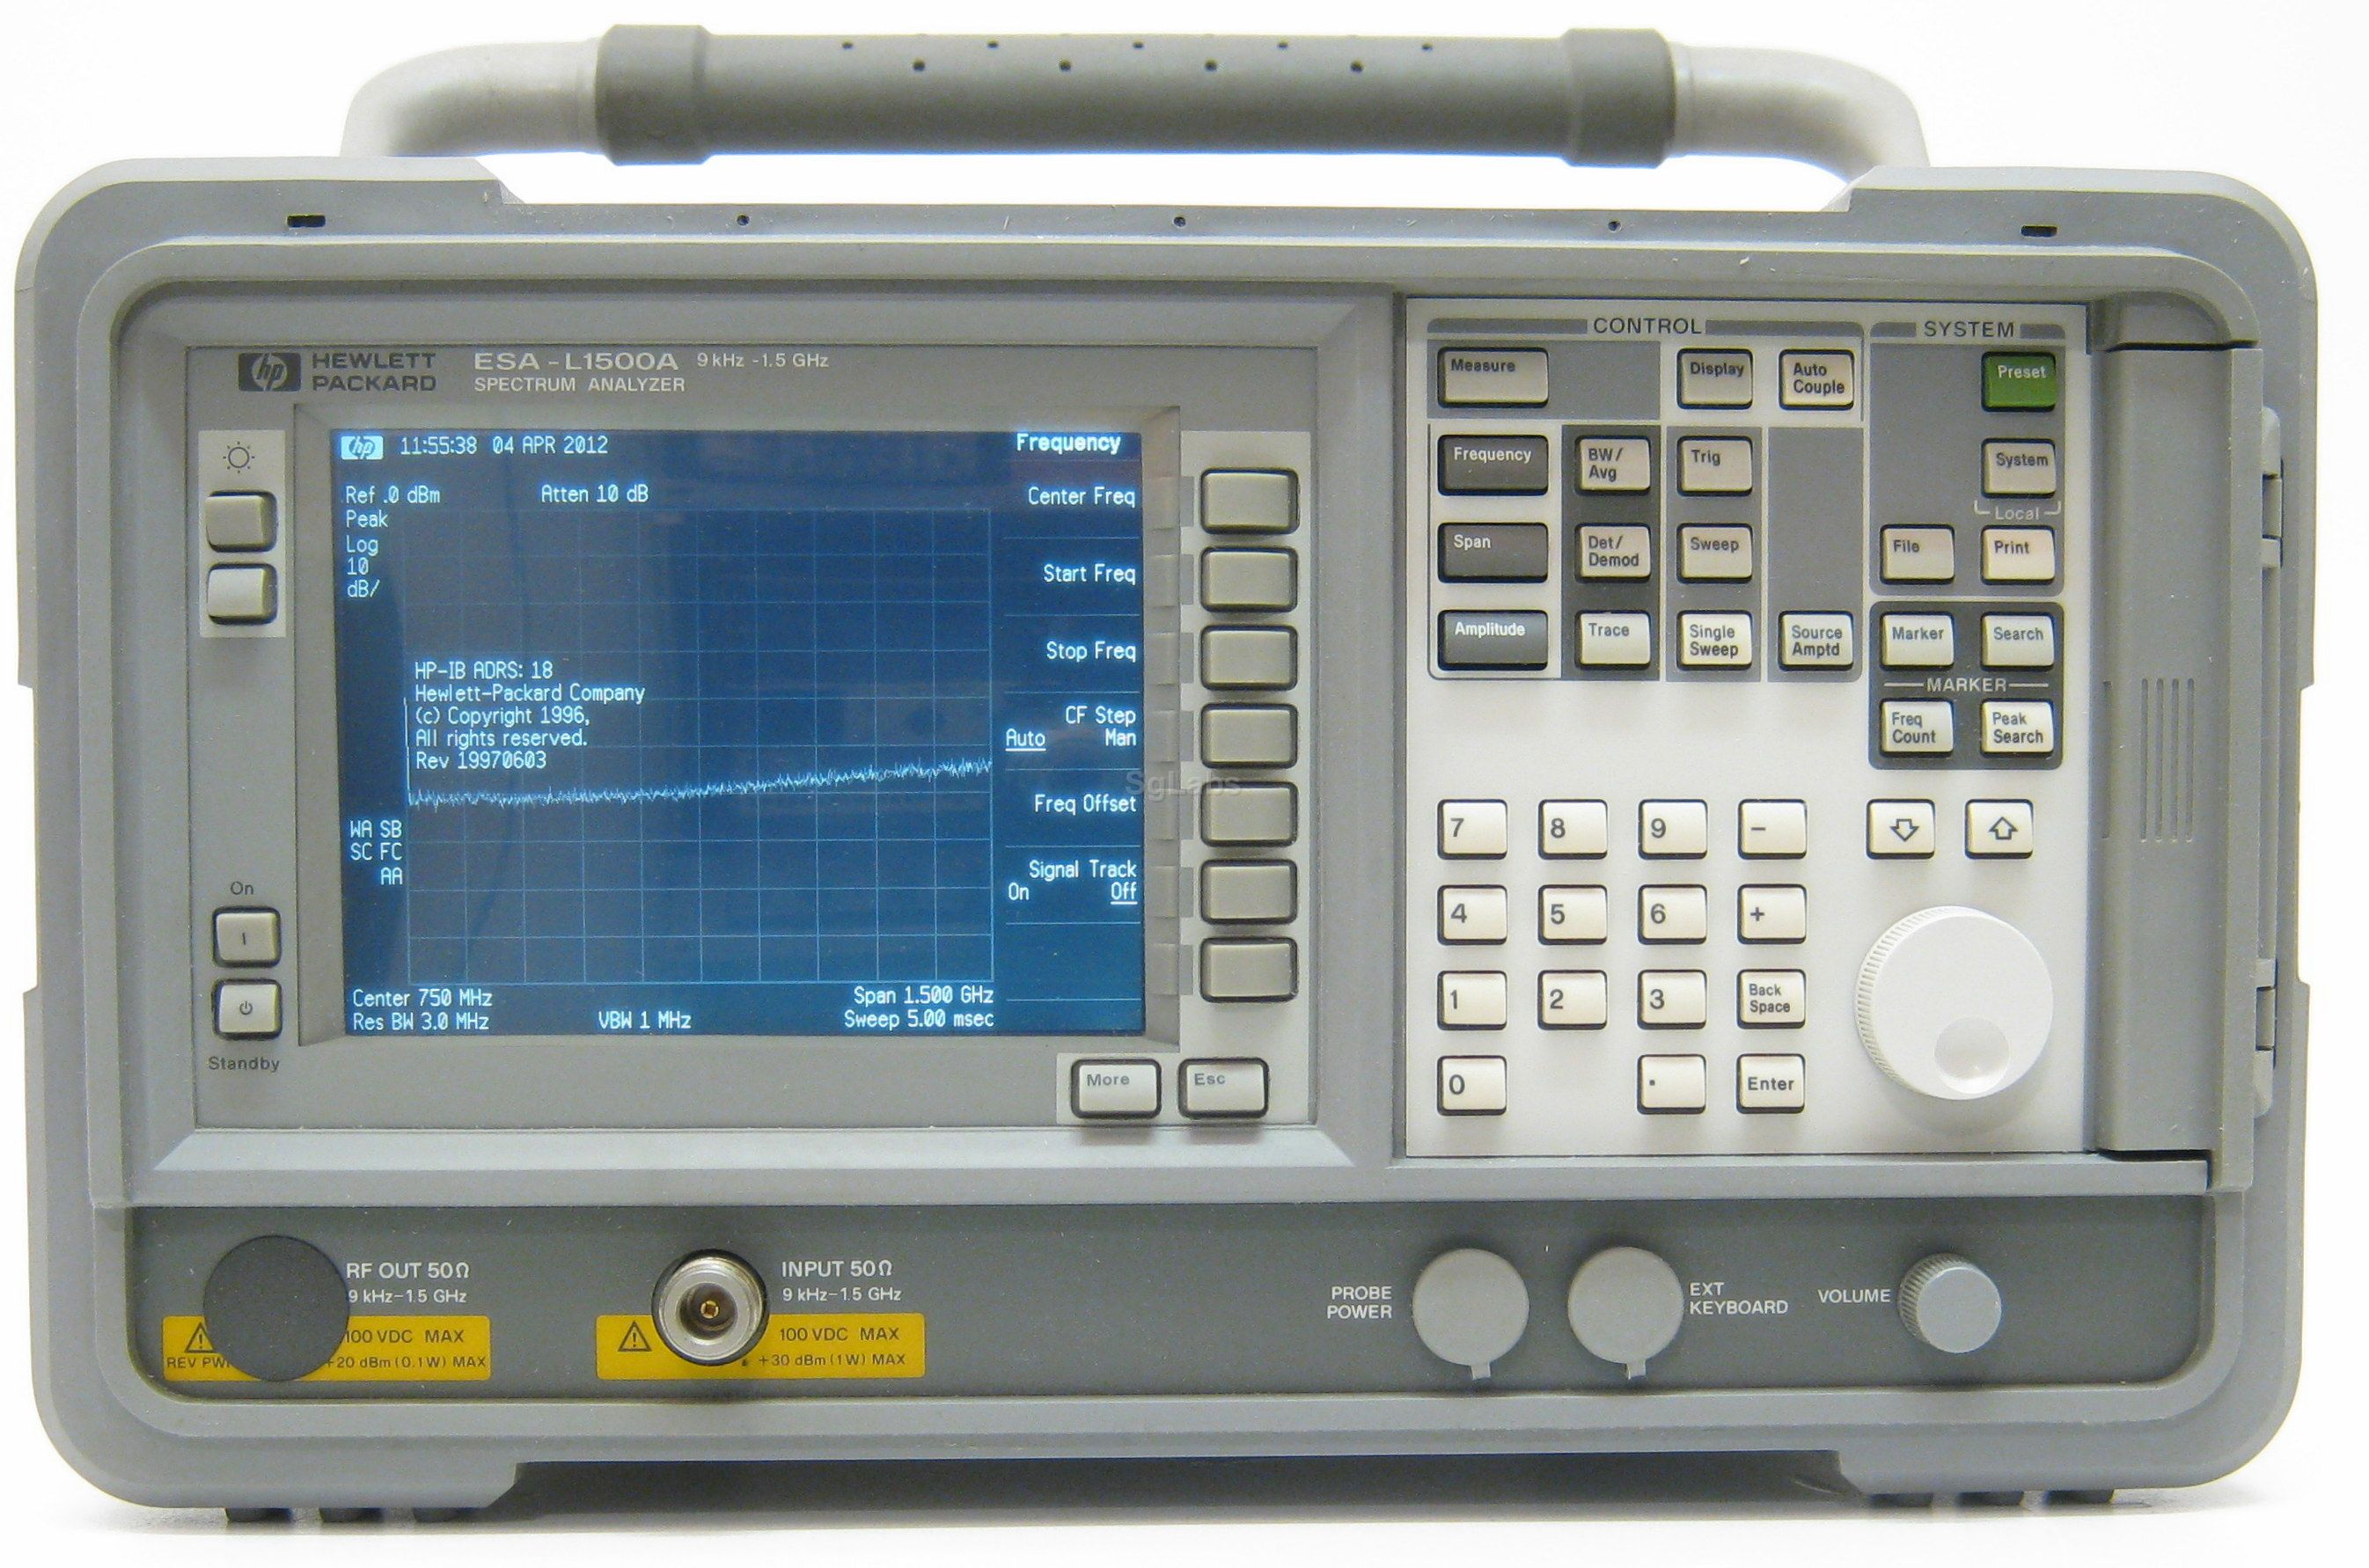
Above is a picture of the spectrum analyzer you will use (ESA L1500A). The SA operates by using a mixer to down convert the input signal to an IF, then passing that through a RBW, then finding the total power in the RBW (note: it is not measuring the amplitude, but power and it is integrated power) and then plotting that as one point on the screen. The continuous trace you see on the screen is a point for each LO frequency that the LO is swept. In the example above, it is swept from 0.75 GHz to 1.5 GHz. A VBF is used to remove some of the fluctuations on the screen (it does not filter noise of the signal, just of what is plotted on the screen).
Attach a 10dB attenuator at the input (just for this lab). This is to protect the unit and also lower the signal so that we can play around with SNR.
Some controls and functions to note for the spectrum analyzer:
- Frequency: Set the Start freq. to 0.9 GHz and the Stop freq. to 1.1 Ghz. Alternatively, you can set the Center to 1 GHz and hit the Span key to 200 MHz.
- BW/AVG key for RBW and VBW. Set to Auto, hit key next to text to go to manual control. You can turn the knob to adjust the value or you can just start typing on the number keypad, you will see units appear to associate with your number.
- RBW, Resolution Bandwidth: Sets the bandwidth of the IF filter for the SA. Displayed signal power is the integrated power over the RBW. Lower BW allows for accurately resolving between two signals.
- VBW: Sets the BW of the low pass filter after the signal power has been detected. It reduces noise on the detector and reduces peak-to-peak fluctuations in the signal.
- Amplitude button (Ref Level) : Adjusts the zero level of the y-axis and scale. You don’t need to adjust that now, but may need to for the last few questions of the lab.
- Marker button: You can select between four markers. You can select the type, such as normal, which just places a marker that you move with the knob. Another one is Delta, which places two cursors, you can move one of them and it plots the delta. This is good for measuring the height of a feature, i.e. the mag of a peak from the noise floor. The Marker peak search is also good to find the peak of a spectrum.
- Overall the input is very intuitive once you know what you want to change.
Set the output of the signal source to -50 dBm at 1 Ghz and attach a 10dB attenuator to the input. You can use the Carrier ON/OFF button to enable the output – it is next to the cable output. Connect the RF output directly to the SA via the attenuator and the cables provided. Use the Amplitude button to set the attenuation to Manual and use 0dB. Set the Detector using the Det/Demod button to Sample. Then insert amps and filters as outlined below.
Notes:
- Any spurs in the spectrum that are time variant are noise and should not be considered as signal.
- The amplifiers are wideband and therefore their PSRR is not very high. This means that variation in supply voltage may cause them to oscillate. This will be seen on the Spectrum Analyzer as a lot of harmonics around the expected signal frequencies. This is observed more frequently when the amplifiers are biased using the same supply. Thus it is advised to use three different supplies for biasing the three amplifiers if necessary.
- Changing the Reference Level may show you a clipped value of the signal. If the Attenuation is set to Auto, the spectrum analyzer increases it based on when the signal is being clipped (too high gain etc.). However, auto attenuation also increases the risk of damaging the spectrum analyzer in case the input power is too high (read the label next to RF input – it states max input DC voltage and power allowed for this model).
Assignment (7pts):
Set RBW to 3MHz and VBW to 1MHz. Set the Detector using the Det/Demod button to Sample.
- Do you see the signal on the SA?
- Change the RBW to 1 MHz, do you see the signal?
- Change the RBW to 100 kHz, do you see it now?
- Decrease the VBW 1KHz. What changes? Does the noise floor get lower?
- What is the average power level of the noise floor for 100KHz, 1 MHz and 3MHz RWB, with VBW=1KHz.
- How does the RBW affect the noise?
- How does the VBW affect the noise?
Assignment (8 pts):
- Set the RBW to 100KHZ, VBW=300Hz. Add an additional 20dB attenuator.
- Can you see the signal? What is the noise floor?
- Insert one amplifier into the circuit between the input and the attenuator. (Make sure to note the IN, OUT ports). What is the signal power and the noise floor with? What is the signal to noise floor (note this is not SNR)?
- Disconnect the input (leave output there), what is the noise floor?
- Insert a second amplifier and answer the same questions.
- Disconnect the input (leave output there), what is the noise floor?
- Insert a third amplifier and answer the same questions.
- Disconnect the input (leave output there), what is the noise floor?
- Does the SNR (or signal to noise floor, SNF) increase as you add more amps? If not, why?
Assignment (2 pts – ignore grey text – no BPF):
- Insert a BPF at the input with the three amplifiers, what is the signal, floor and SNF? (leave markers where they were for w/o BPF, so the comparison is the same).
- Insert the BPF between first and second amp. What is the signal, floor and SNF?
- Insert the BPF between the second and third amp. What is the signal, floor and SNF?
- Where did the BPF make the most difference and why?
- What is the SNR of the 1,2 and 3 amps (no filter) for a channel BW of 300 kHz. Assume that you have a sharp BPF that filters out everything but what are in the channel BW. You should calculate this from your data on the above, i.e. determine the noise floor of 300 kHz analytically.
- Remove all amplifiers, what is the minimum power you can detect from the source. To do this you can configure the SA any way you want. To decide what is “detect” you must to a peak search with the cursor and find the same 1 GHz signal each time. Try to go as low in power as possible.
Comments are closed.